Overview
info Hint This chapter covers the Nest Devtools integration with the Nest framework. If you are looking for the Devtools application, please visit the Devtools website.
To start debugging your local application, open up the main.ts file and make sure to set the snapshot attribute to true in the application options object, as follows:
async function bootstrap() {
  const app = await NestFactory.create(AppModule, {
    snapshot: true,
  });
  await app.listen(3000);
}
This will instruct the framework to collect necessary metadata that will let Nest Devtools visualize your application's graph.
Next up, let's install the required dependency:
$ npm i @nestjs/devtools-integration
warning Warning If you're using
@nestjs/graphqlpackage in your application, make sure to install the latest version (npm i @nestjs/graphql@11).
With this dependency in place, let's open up the app.module.ts file and import the DevtoolsModule that we just installed:
@Module({
  imports: [
    DevtoolsModule.register({
      http: process.env.NODE_ENV !== 'production',
    }),
  ],
  controllers: [AppController],
  providers: [AppService],
})
export class AppModule {}
warning Warning The reason we are checking the
NODE_ENVenvironment variable here is that you should never use this module in production!
Once the DevtoolsModule is imported and your application is up and running (npm run start:dev), you should be able to navigate to Devtools URL and see the instrospected graph.
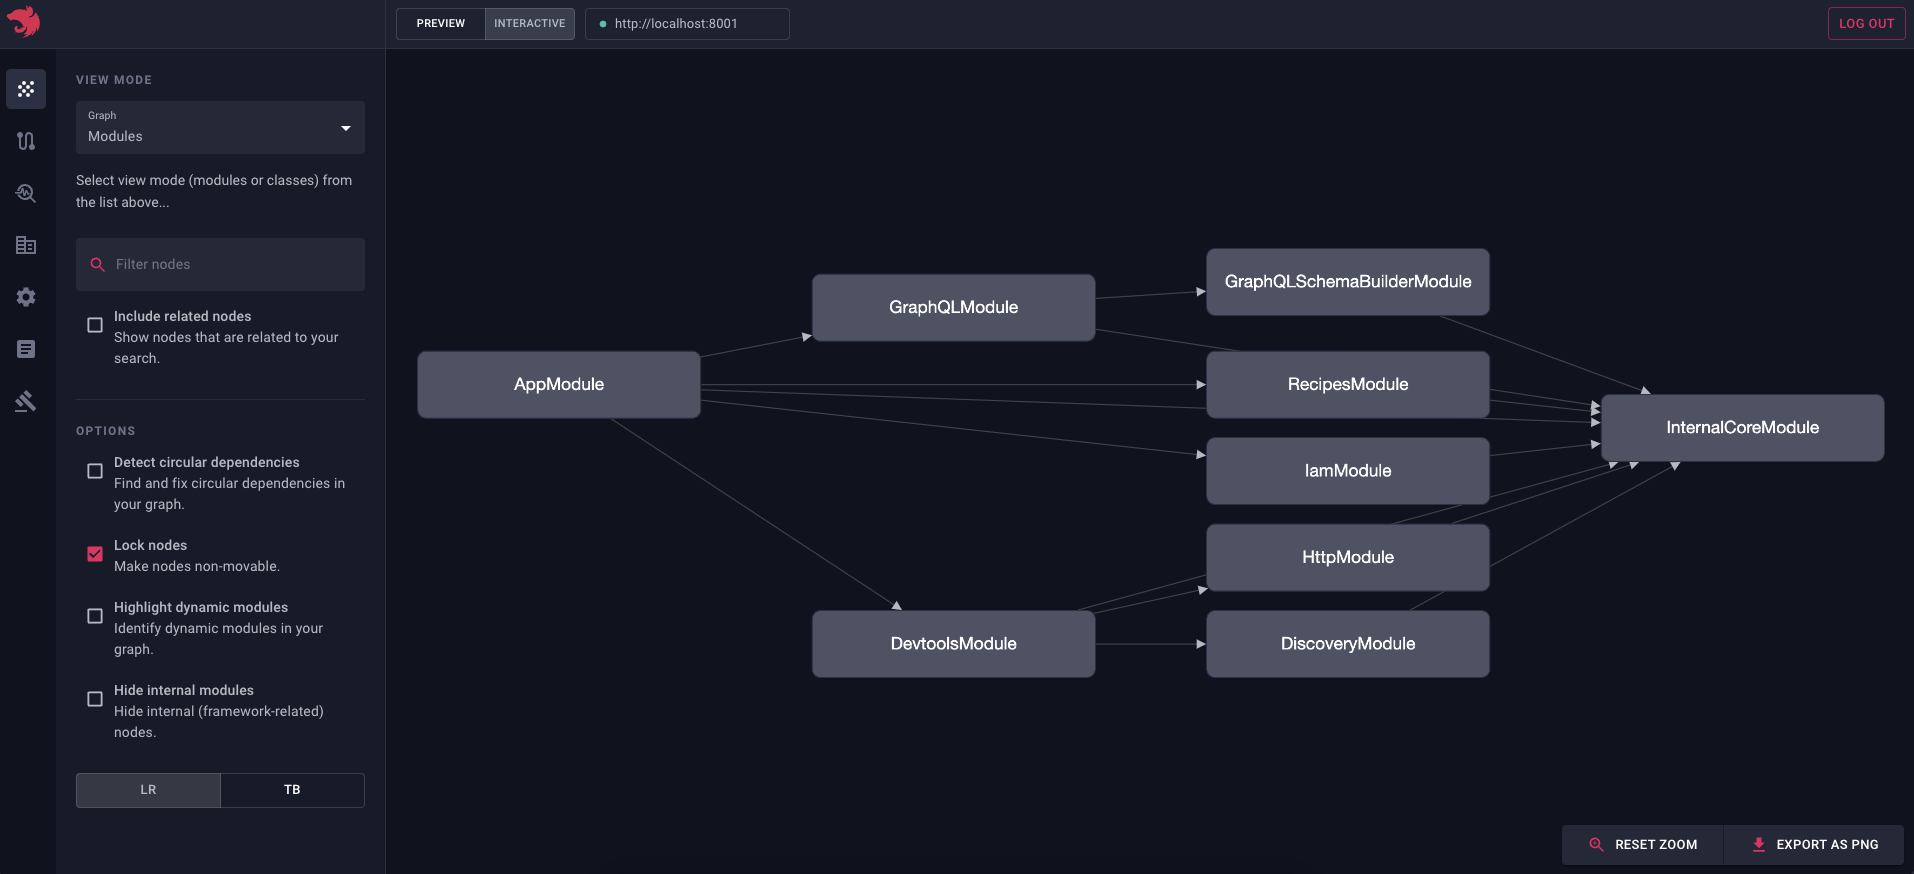
info Hint As you can see on the screenshot above, every module connects to the
InternalCoreModule.InternalCoreModuleis a global module that is always imported into the root module. Since it's registered as a global node, Nest automatically creates edges between all of the modules and theInternalCoreModulenode. Now, if you want to hide global modules from the graph, you can use the "Hide global modules" checkbox (in the sidebar).
So as we can see, DevtoolsModule makes your application expose an additional HTTP server (on port 8000) that the Devtools application will use to introspect your app.
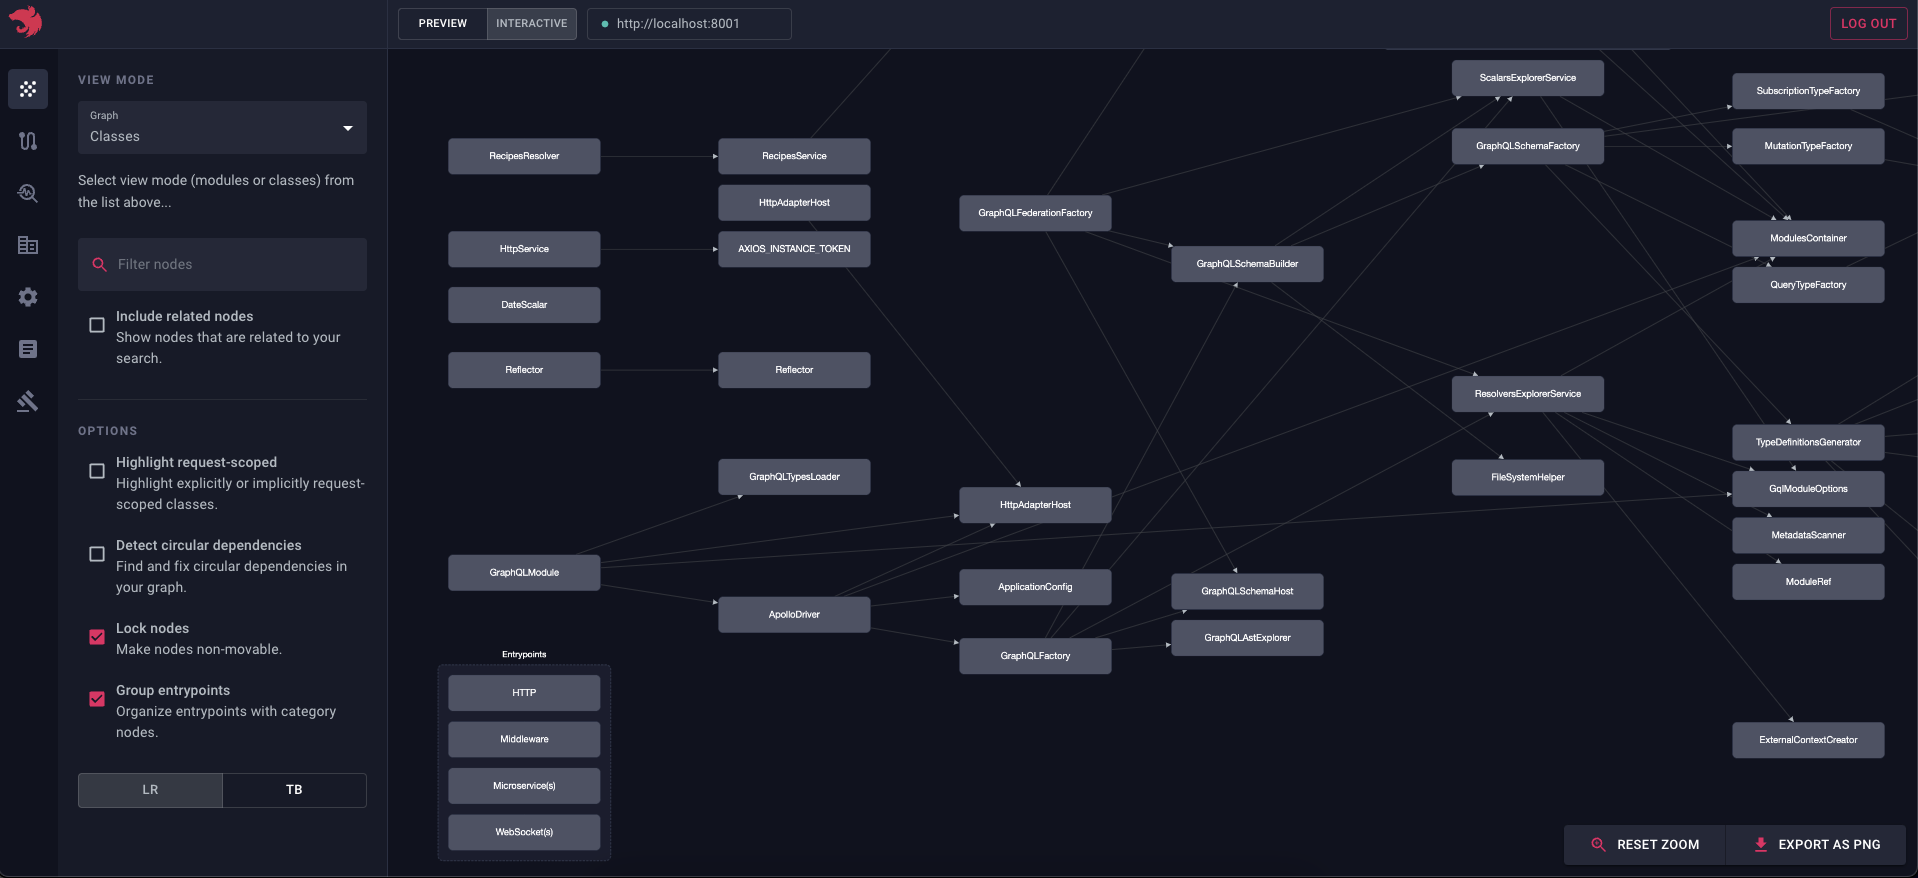
Just to double-check that everything works as expected, change the graph view to "Classes". You should see the following screen:
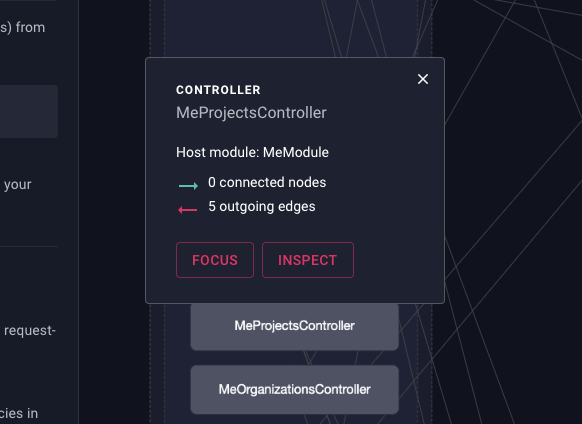
To focus on a specific node, click on the rectangle and the graph will show a popup window with the "Focus" button. You can also use the search bar (located in the sidebar) to find a specific node.
info Hint If you click on the Inspect button, application will take you to the
/debugpage with that specific node selected.
info Hint To export a graph as an image, click on the Export as PNG button in the right corner of the graph.
Using the form controls located in the sidebar (on the left), you can control edges proximity to, for example, visualize a specific application sub-tree:
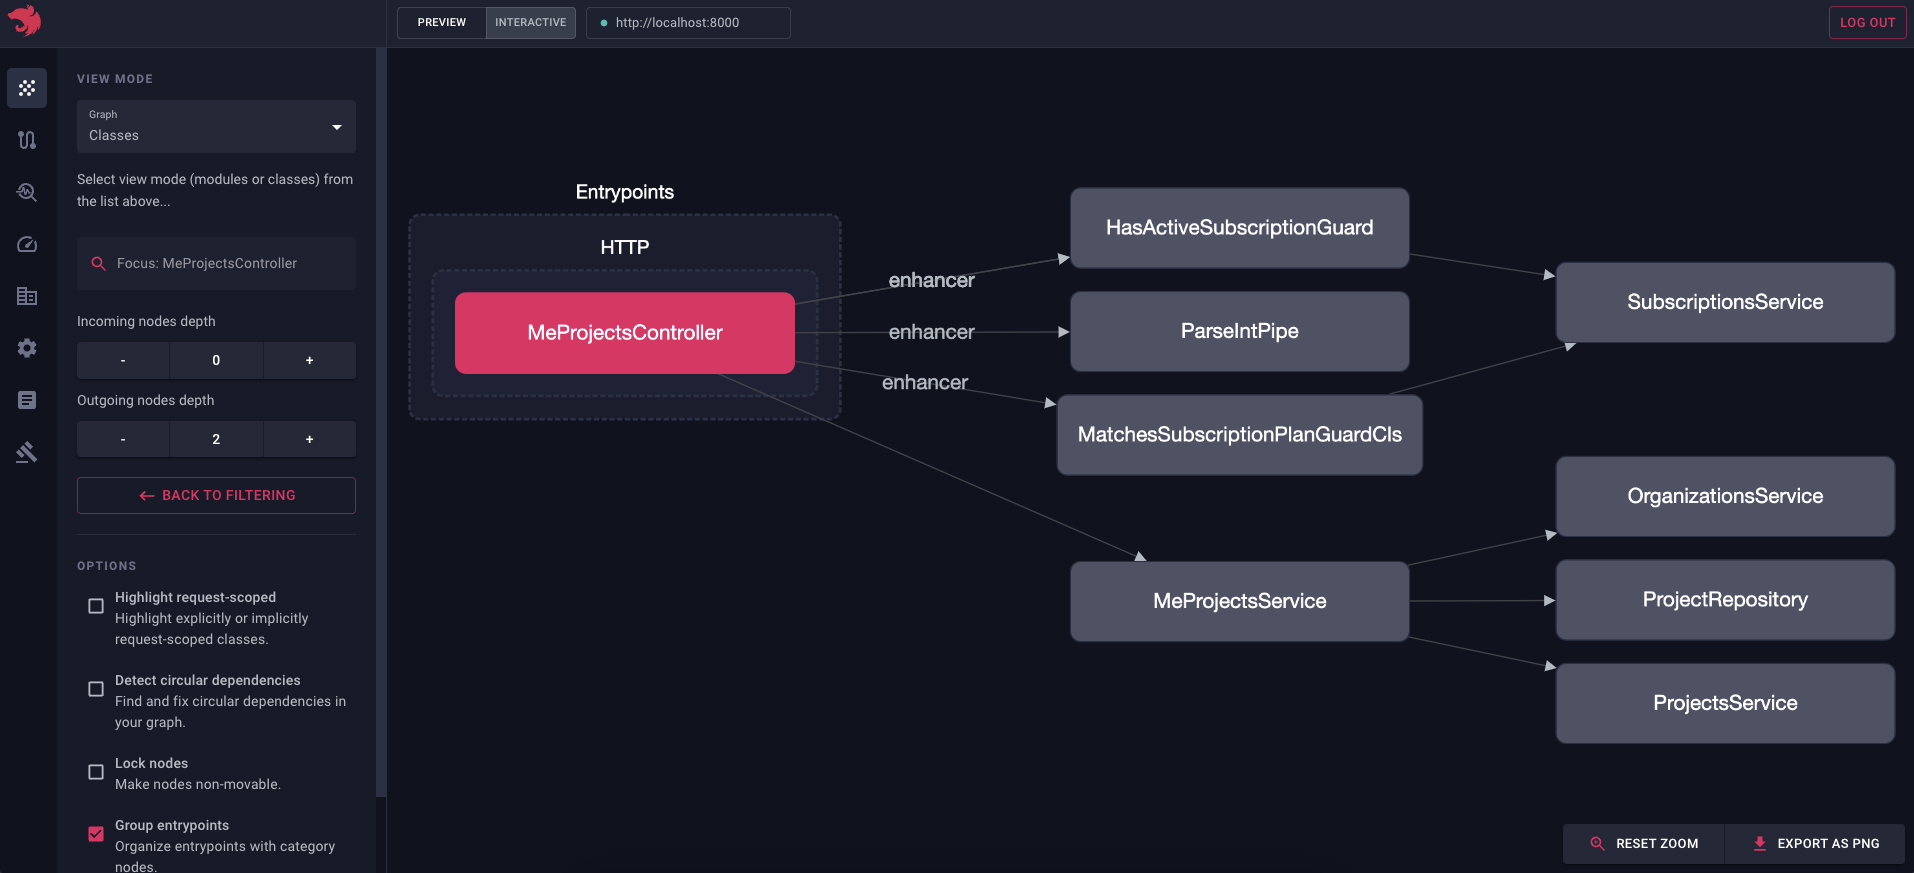
This can be particularly useful when you have new developers on your team and you want to show them how your application is structured. You can also use this feature to visualize a specific module (e.g. TasksModule) and all of its dependencies, which can come in handy when you're breaking down a large application into smaller modules (for example, individual micro-services).
You can watch this video to see the Graph Explorer feature in action:
Investigating the "Cannot resolve dependency" error
info Note This feature is supported for
@nestjs/core>=v9.3.10.
Probably the most common error message you might have seen is about Nest not being able to resolve dependencies of a provider. Using Nest Devtools, you can effortlessly identify the issue and learn how to resolve it.
First, open up the main.ts file and update the bootstrap() call, as follows:
bootstrap().catch((err) => {
  fs.writeFileSync('graph.json', PartialGraphHost.toString() ?? '');
  process.exit(1);
});
Also, make sure to set the abortOnError to false:
const app = await NestFactory.create(AppModule, {
  snapshot: true,
  abortOnError: false, // <--- THIS
});
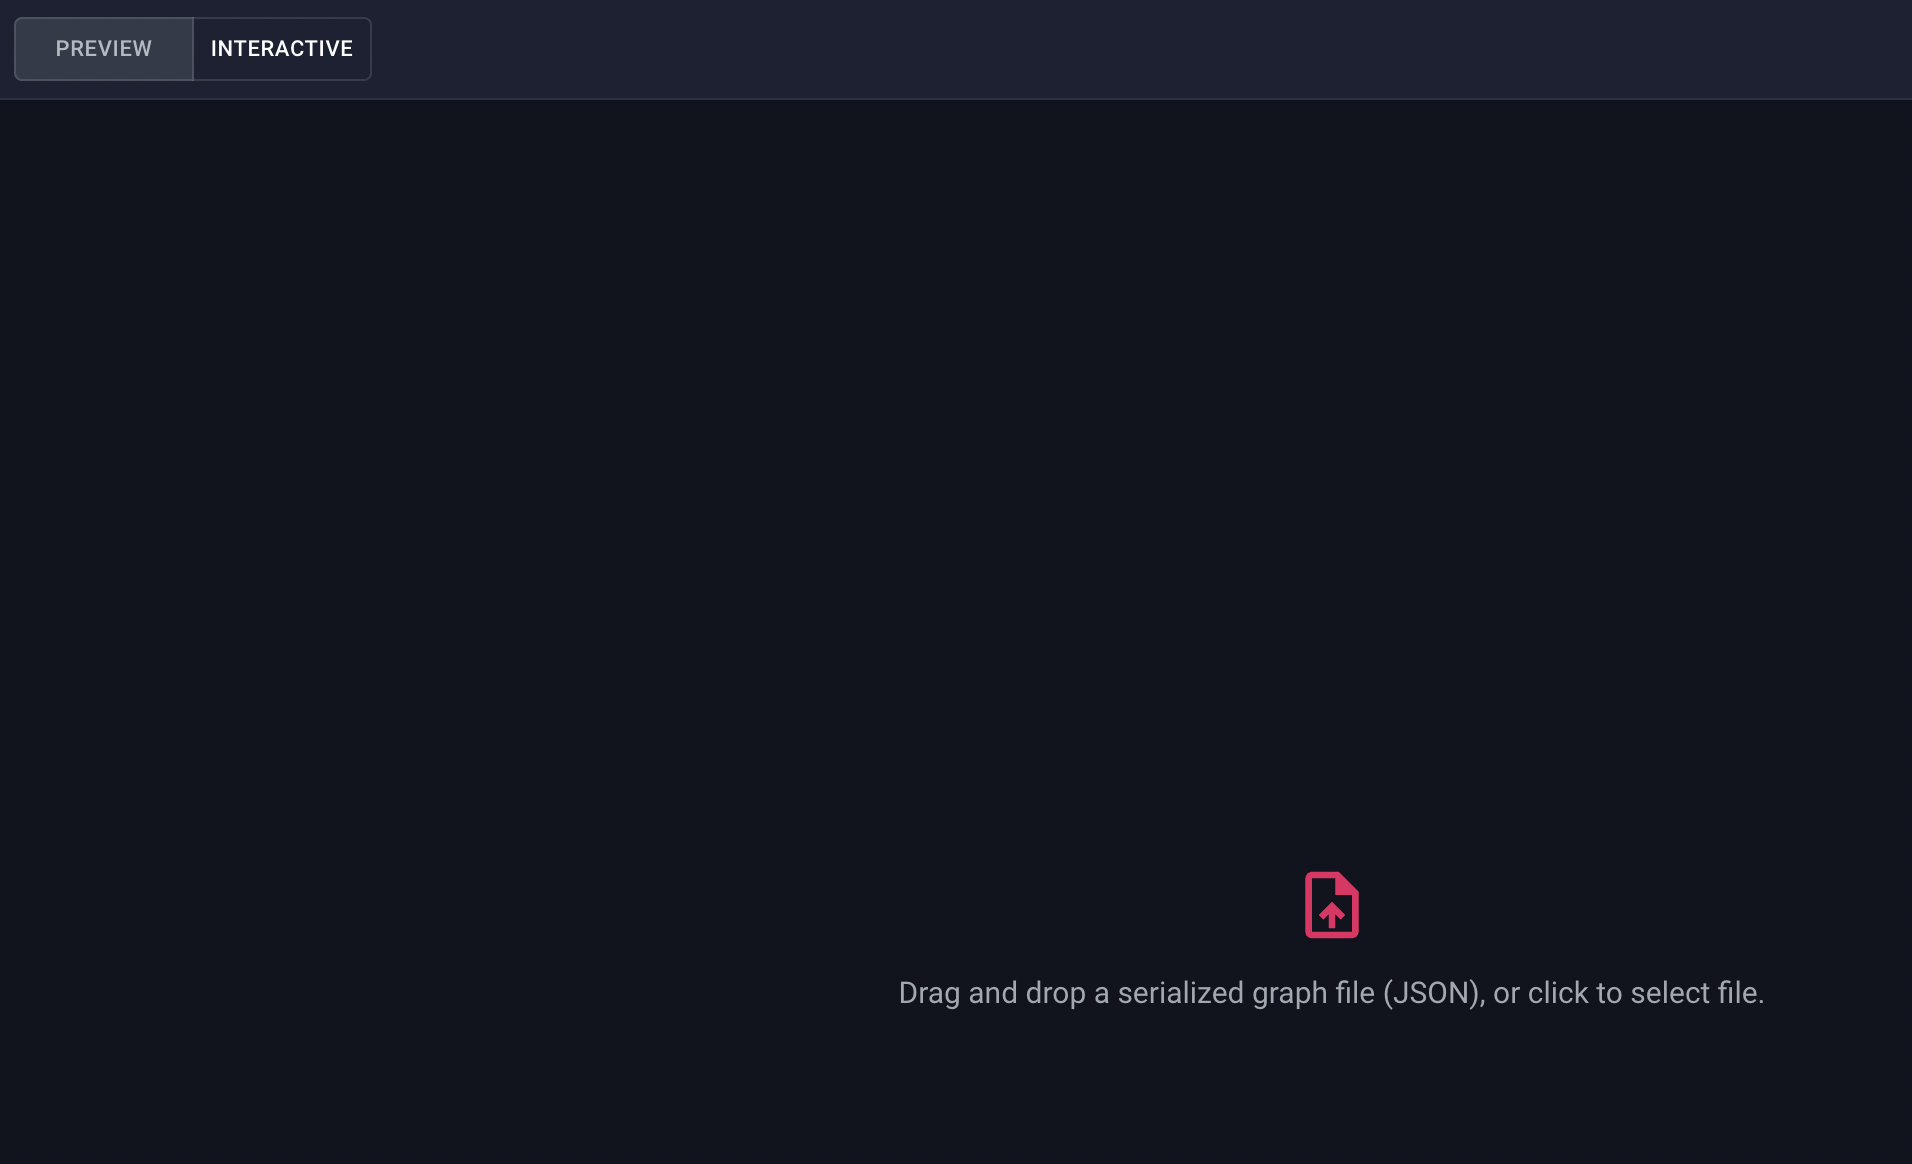
Now every time your application fails to bootstrap due to the "Cannot resolve dependency" error, you'll find the graph.json (that represents a partial graph) file in the root directory. You can then drag & drop this file into Devtools (make sure to switch the current mode from "Interactive" to "Preview"):
Upon successful upload, you should see the following graph & dialog window:
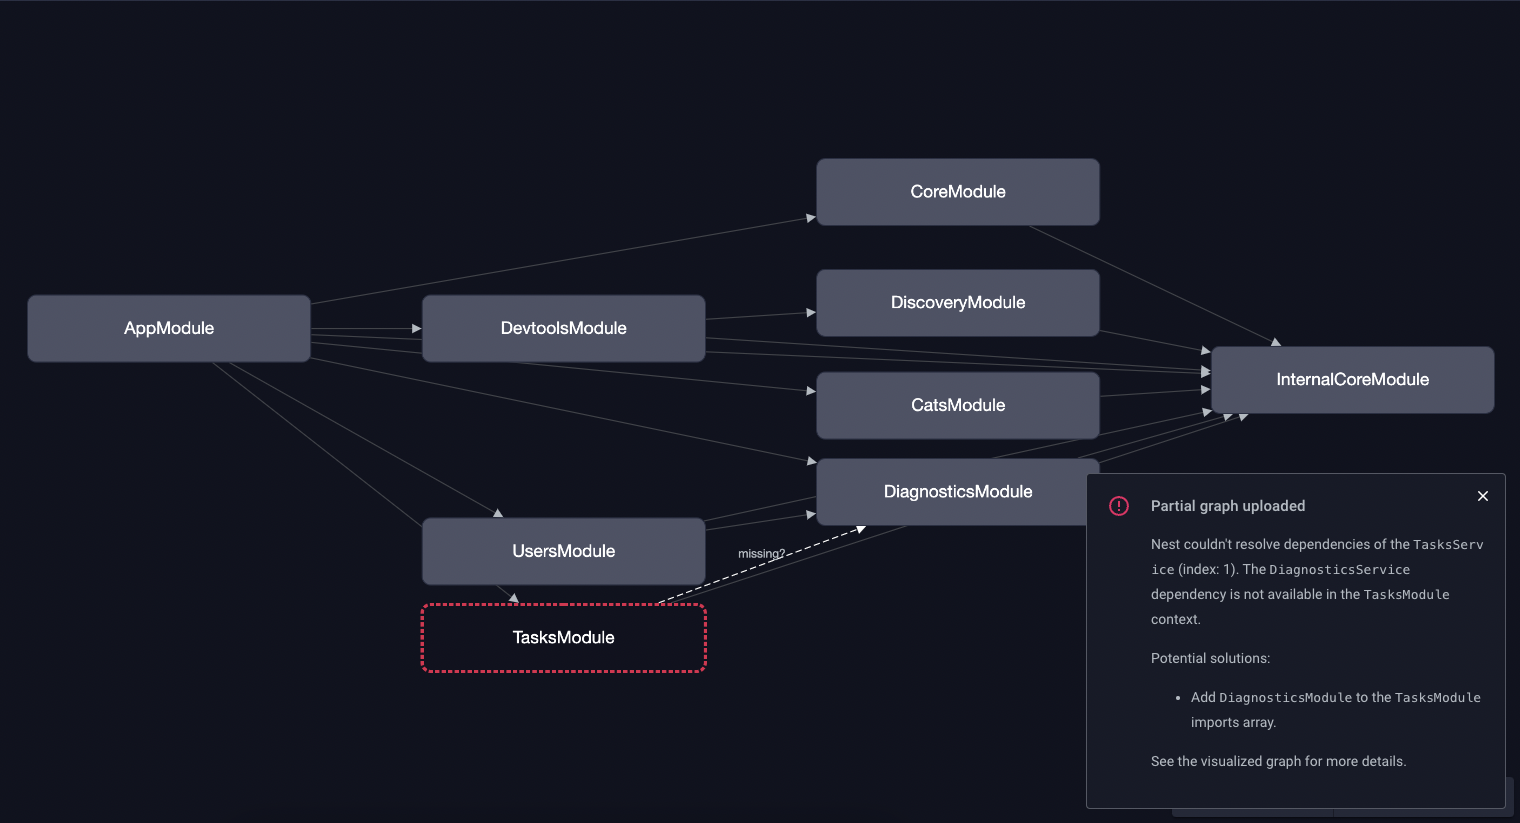
As you can see, the highlighted TasksModule is the one we should look into. Also, in the dialog window you can already see some instructions on how to fix this issue.
If we switch to the "Classes" view instead, that's what we'll see:
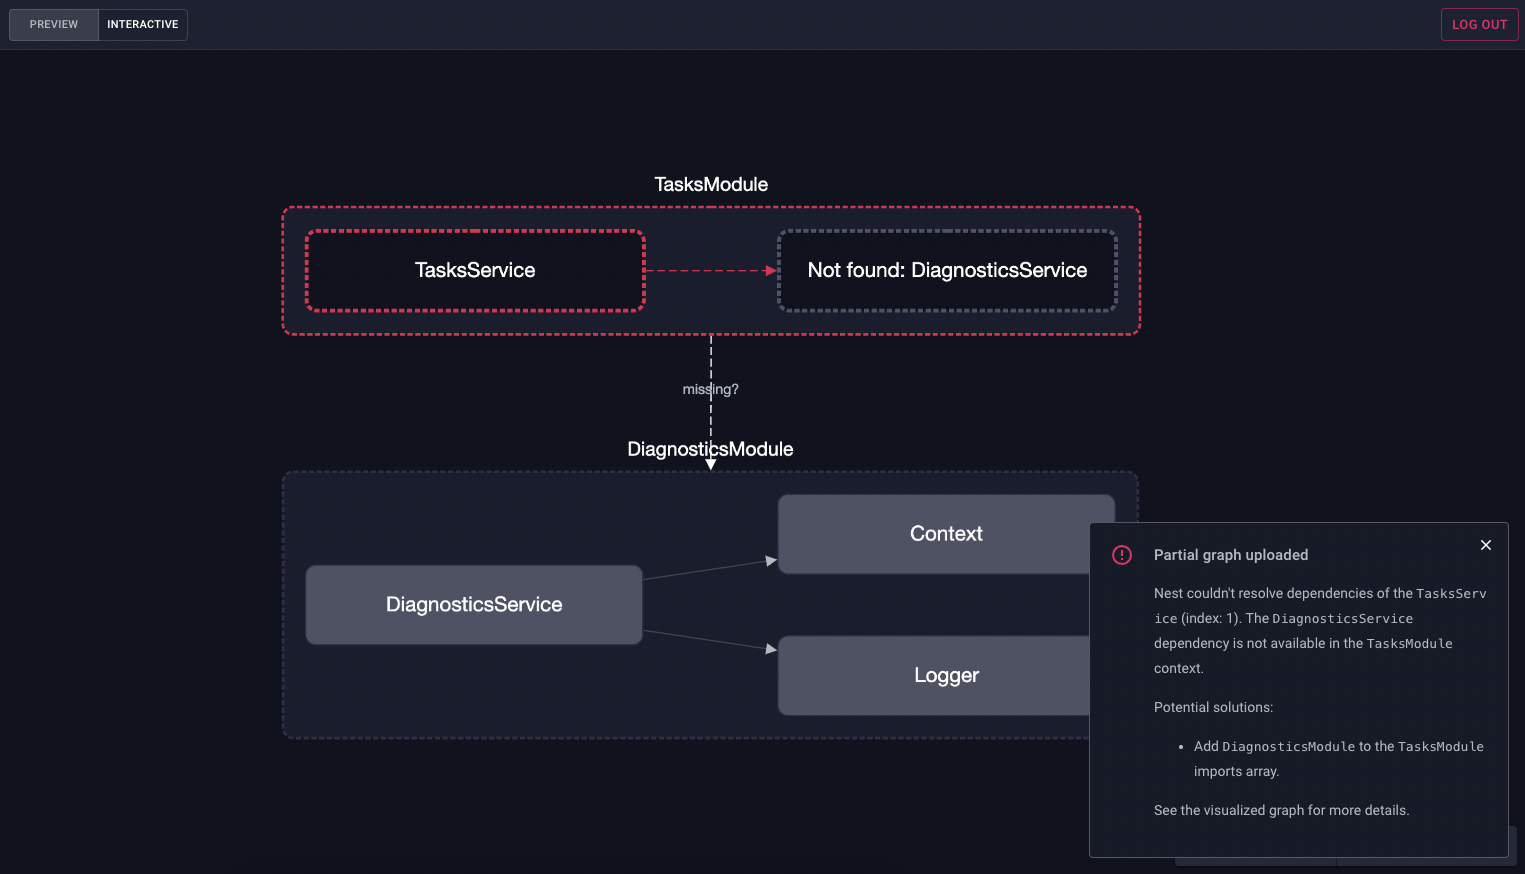
This graph illustrates that the DiagnosticsService which we want to inject into the TasksService was not found in the context of the TasksModule module, and we should likely just import the DiagnosticsModule into the TasksModule module to fix this up!
Routes explorer
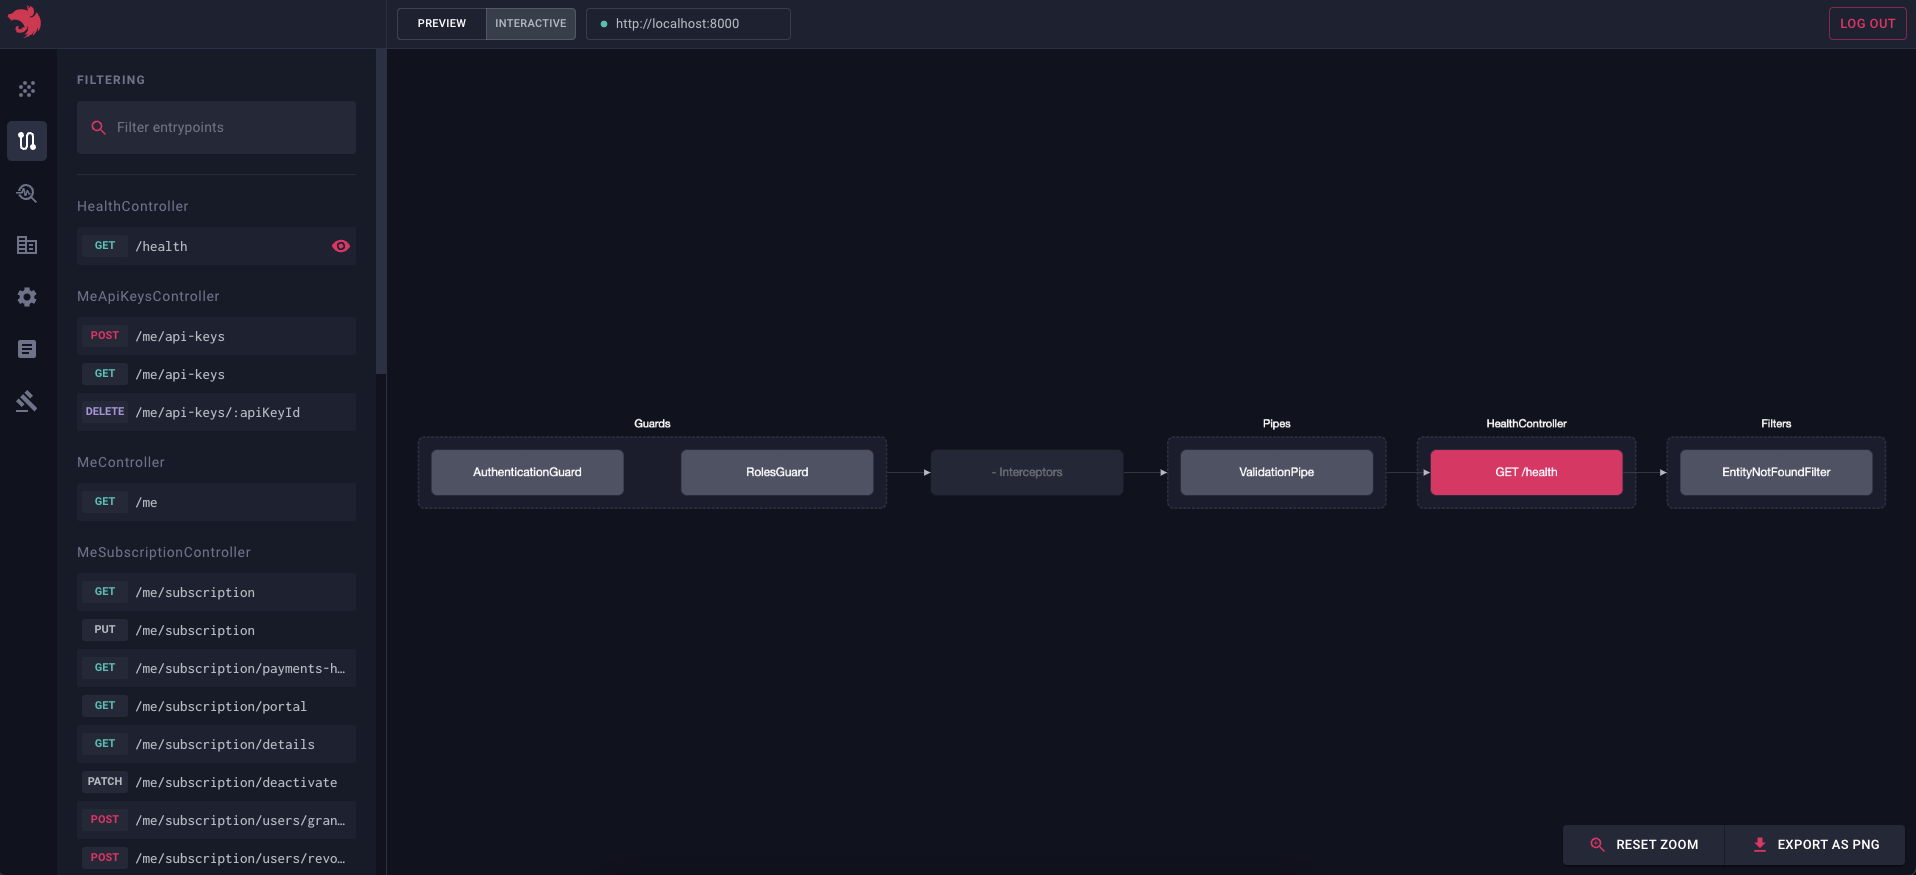
When you navigate to the Routes explorer page, you should see all of the registered entrypoints:
info Hint This page shows not only HTTP routes, but also all of the other entrypoints (e.g. WebSockets, gRPC, GraphQL resolvers etc.).
Entrypoints are grouped by their host controllers. You can also use the search bar to find a specific entrypoint.
If you click on a specific entrypoint, a flow graph will be displayed. This graph shows the execution flow of the entrypoint (e.g. guards, interceptors, pipes, etc. bound to this route). This is particularly useful when you want to understand how the request/response cycle looks for a specific route, or when troubleshooting why a specific guard/interceptor/pipe is not being executed.
Sandbox
To execute JavaScript code on the fly & interact with your application in real-time, navigate to the Sandbox page:
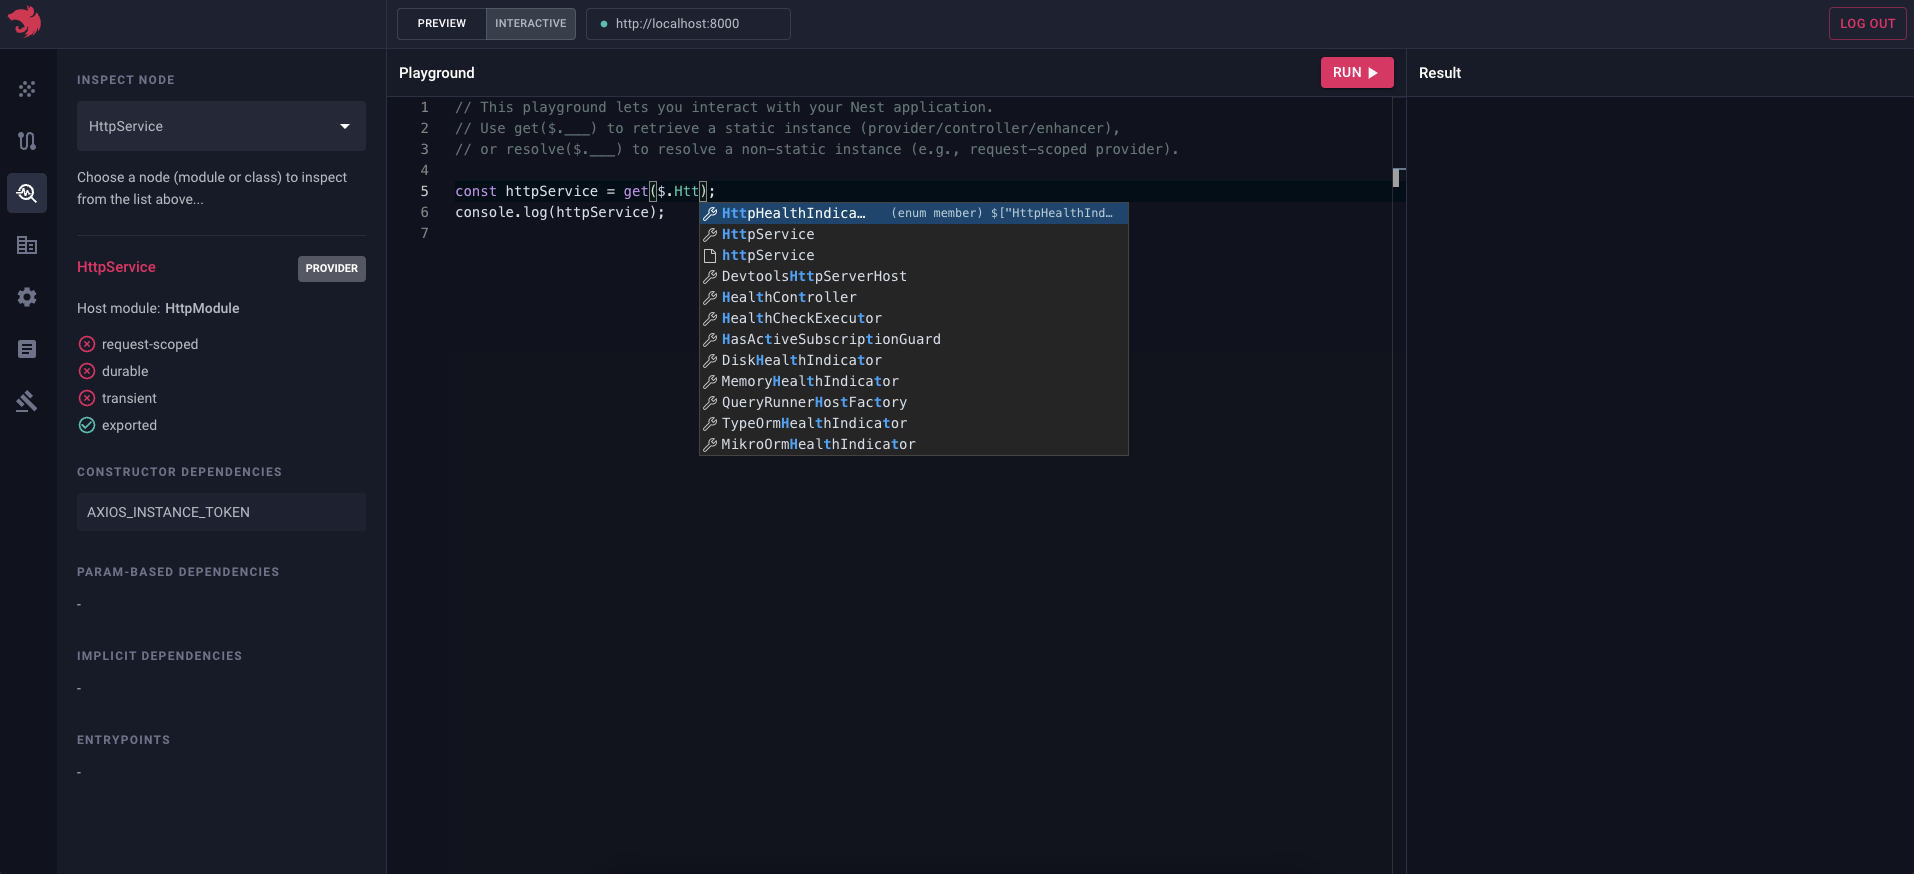
The playground can be used to test and debug API endpoints in real-time, allowing developers to quickly identify and fix issues without using, for example, an HTTP client. We can also bypass the authentication layer, and so we no longer need that extra step of logging in, or even a special user account for testing purposes. For event-driven applications, we can also trigger events directly from the playground, and see how the application reacts to them.
Anything that gets logged down is streamlined to the playground's console, so we can easily see what's going on.
Just execute the code on the fly and see the results instantly, without having to rebuild the application and restart the server.
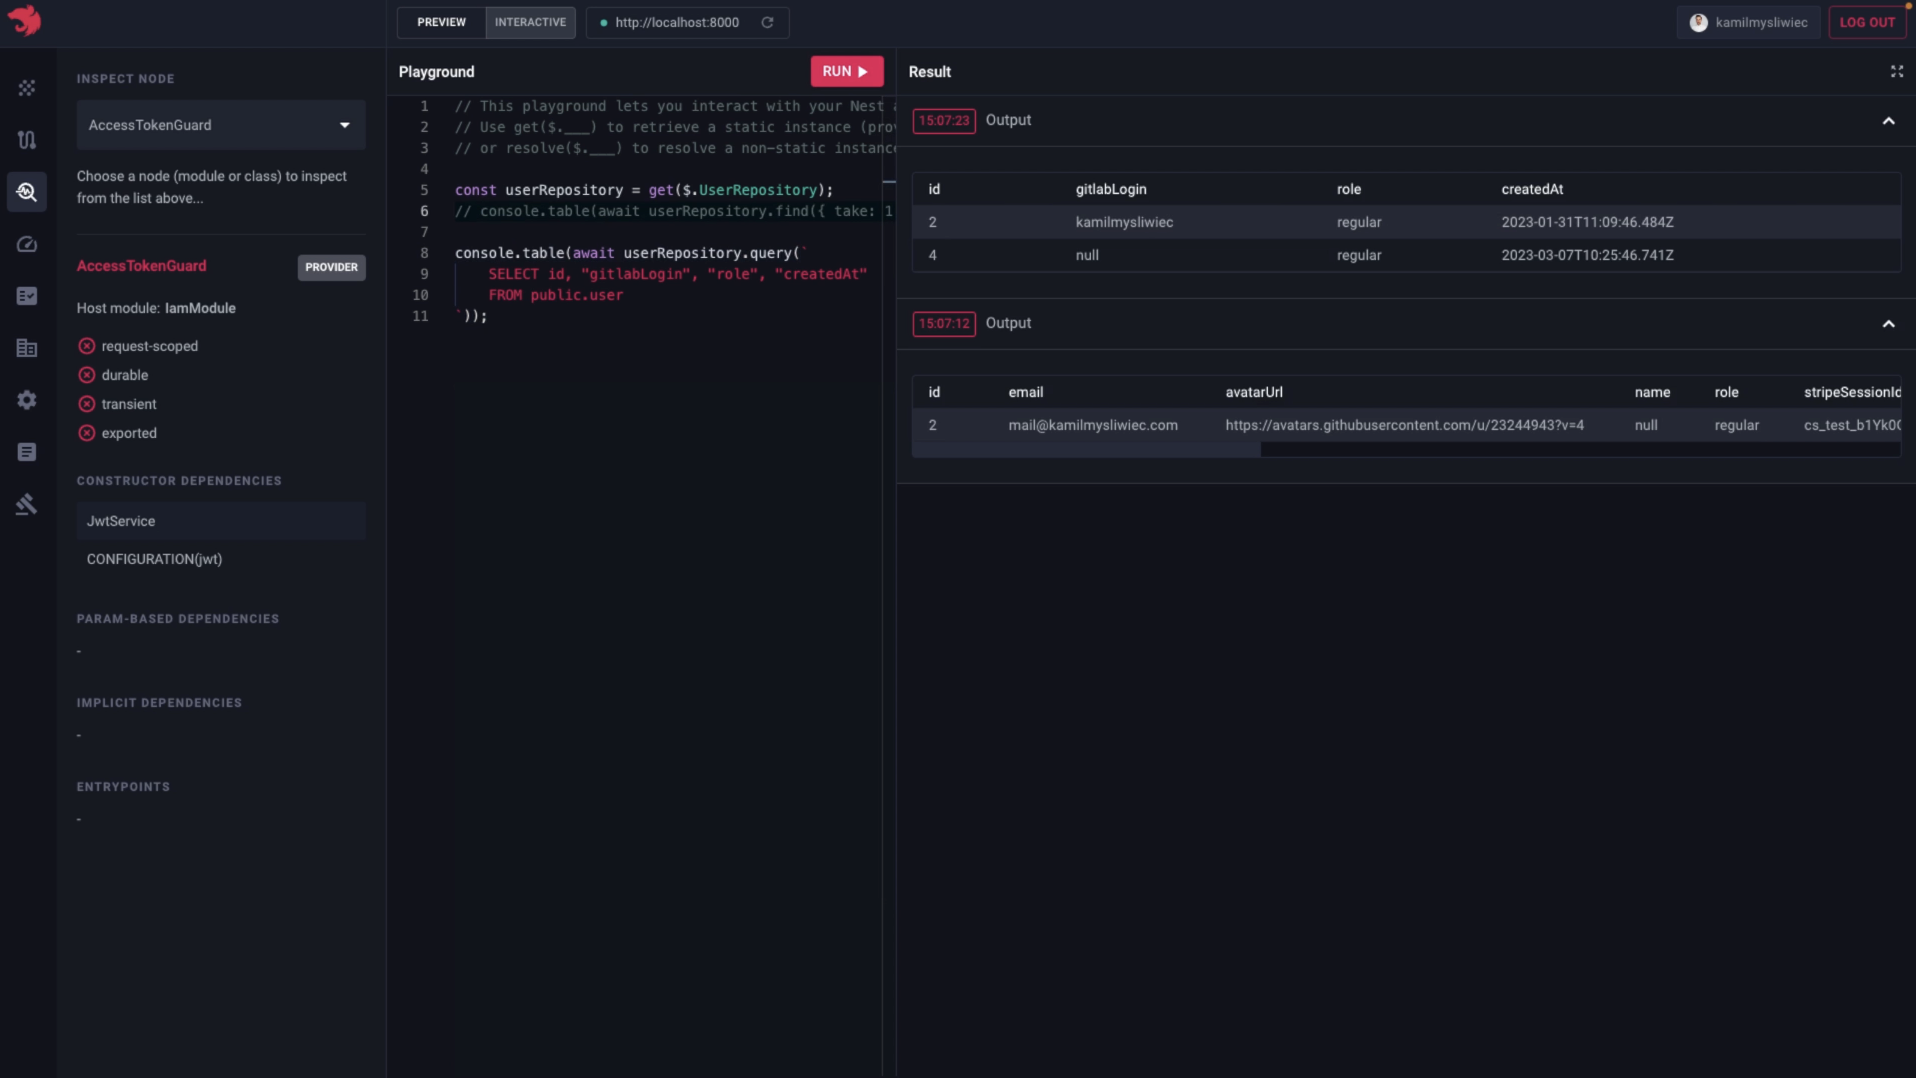
info Hint To pretty display an array of objects, use the
console.table()(or justtable()) function.
You can watch this video to see the Interactive Playground feature in action:
Bootstrap performance analyzer
To see a list of all class nodes (controllers, providers, enhancers, etc.) and their corresponding instantiation times, navigate to the Bootstrap performance page:
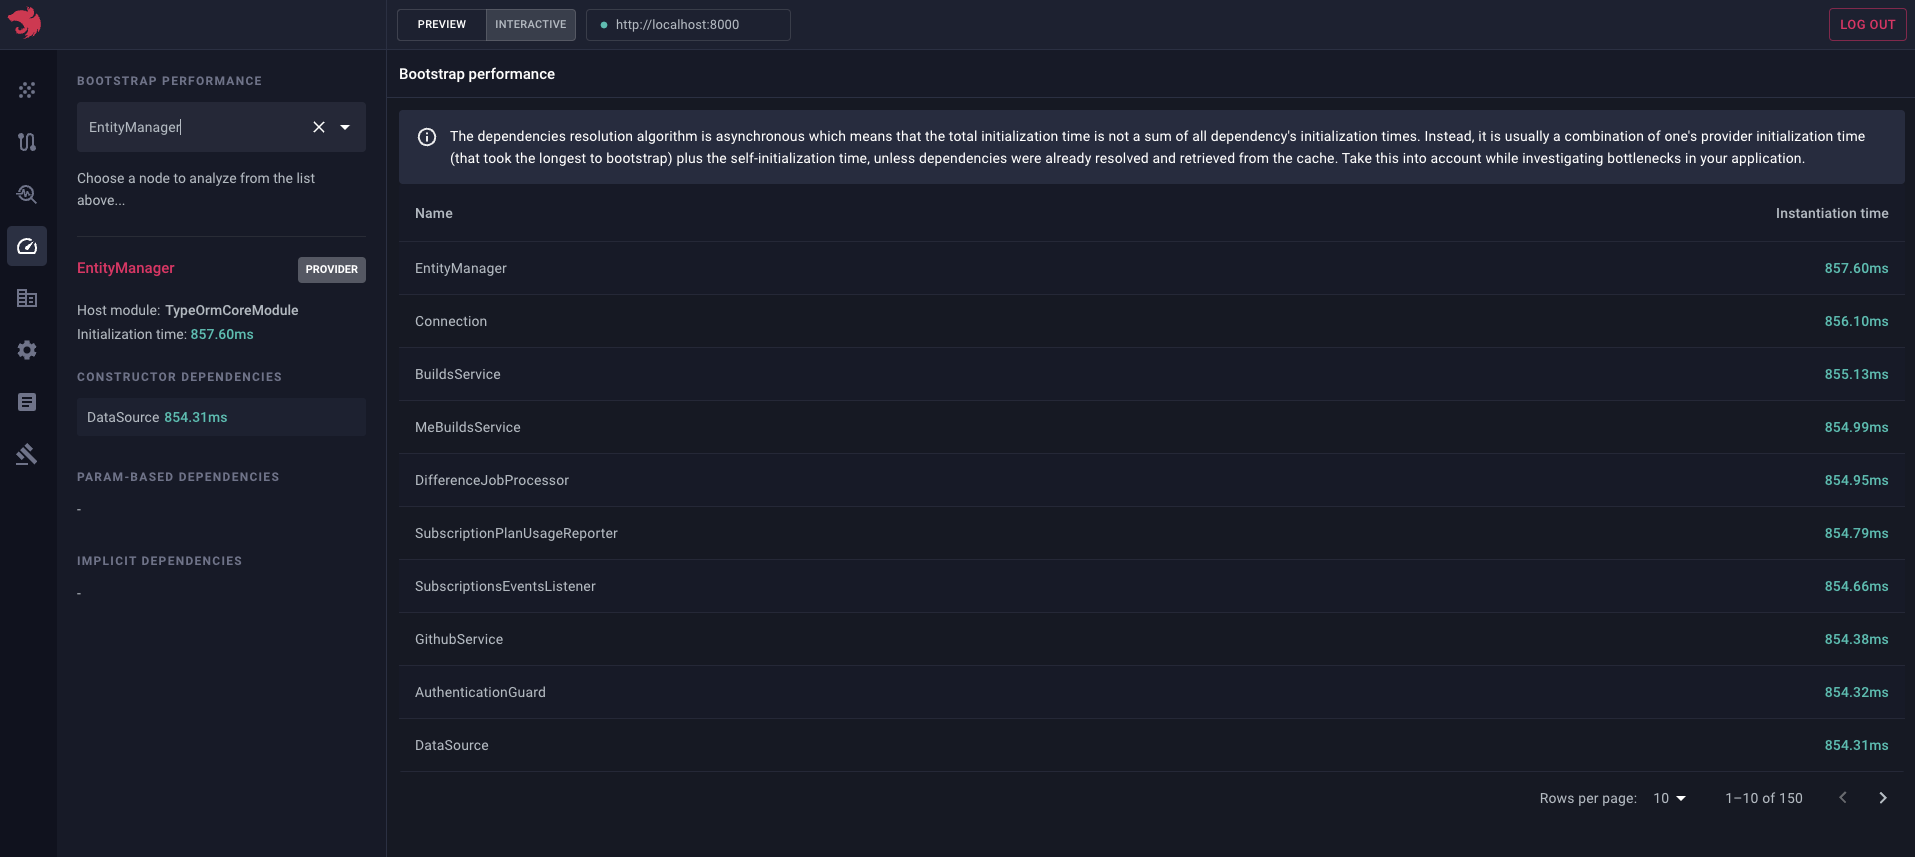
This page is particularly useful when you want to identify the slowest parts of your application's bootstrap process (e.g. when you want to optimize the application's startup time which is crucial for, for example, serverless environments).
Audit
To see the auto-generated audit - errors/warnings/hints that the application came up with while analyzing your serialized graph, navigate to the Audit page:
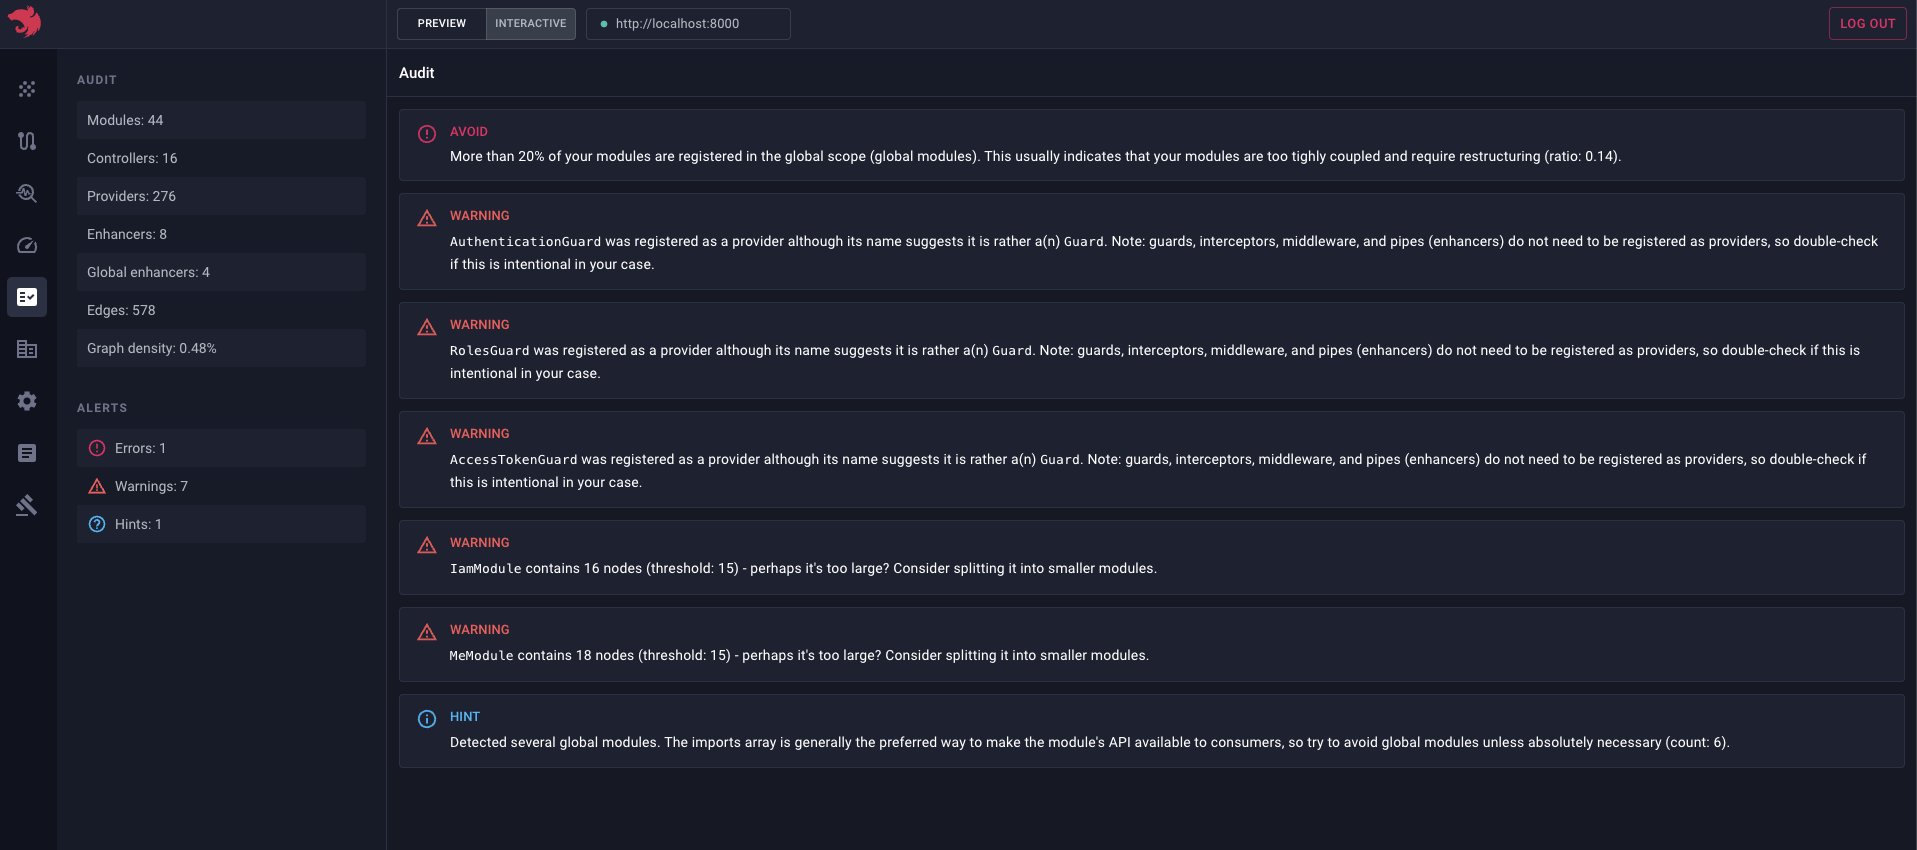
info Hint The screenshot above doesn't show all of the available audit rules.
This page comes in handy when you want to identify potential issues in your application.
Preview static files
To save a serialized graph to a file, use the following code:
await app.listen(3000); // OR await app.init()
fs.writeFileSync('./graph.json', app.get(SerializedGraph).toString());
info Hint
SerializedGraphis exported from the@nestjs/corepackage.
Then you can drag and drop/upload this file:
This is helpful when you want to share your graph with someone else (e.g., co-worker), or when you want to analyze it offline.